T-SQL Tuesday #49 – Wait for it…
December 10, 2013 2 Comments
T-SQL Tuesday is a recurring blog party, that is started by Adam Machanic (Blog | @AdamMachanic). Each month a blog will host the party, and everyone that want’s to can write a blog about a specific subject.
This month the subject is “Wait for it…”. If you want to read the opening post, please click the image below to go to the party-starter: Robert Davis (Blog | @SQLSoldier).
![]()
Explaining developers how SQL Server works is something we all do. Maybe not on a daily basis, but you’re asked questions like “why is my index not working”, or “what’s the best way to add multiple columns to a table”. And most of the time, these questions lead to whole other bunch of questions you need to answer. And the one question we all are asked more than once: “why is my query running slow?”. So where do you start explaining?
Wait Types
There are lots and lots of wait types that can be found in SQL Server. In SQL Server 2005 there are 230 different wait types, 475 in SQL Server 2008 and 491 in SQL Server 2008 R2. In SQL Server 2012 they added another 197 new ones to the list. The wait types can be found by running this query:
SELECT wait_type
FROM sys.dm_os_wait_stats
ORDER BY wait_type ASC
These wait types can tell you what SQL Server is doing to execute your statement, and what the possible delays are. I’m not going to sum up all the wait types, but here’s a short list of common wait types you’ll see on your SQL server:
SOS_SCHEDULER_YIELD
Yielding processor time
LCK_M_*
Waiting for a lock
OLEDB
Wait on the OLEDB provider (Linked servers, Full-Text Search)
WRITELOG
Writing transaction log to disk
RESOURCE_SEMAPHORE
Waiting for a query memory grant
CXPACKET
Query parallelism
PAGEIOLATCH_*
Latch on a memory address while data is retrieved from disk
LAZYWRITER_SLEEP
System process waiting to start
All these different wait types could indicate a problem with your statement or the server. Some are more informative, while others show you a real issue. But what I really would like to show you, is how you can find these wait types.
DIY or just ask for help…
One of the ways to find the wait types on your SQL server, is to dive into the seemingly endless list of DMV’s. You could use the “sys.dm_exec_requests” and “sys.dm_os_waiting_tasks” DMV’s to find what you want, or you could take the easy way out: sp_WhoIsActive by Adam Machanic (Blog | @AdamMachanic ).
Adam (also the party starter of T-SQL Tuesday) wrote a no less than brilliant script to find problems on your server. But how does it work?
Installing sp_WhoIsActive
The “installation” of sp_WhoIsActive couldn’t be easier. You just need to download the script, and run it. This creates a stored procedure in the database of your choice. Usually I just create it in the master database. But if you have a DBA database with useful scripts, it’s okay to create it there.
Running it for the first time
The stored procedure can be executed without any parameters. That way, you use the default options. Just run the statement shown below:
EXEC master.dbo.sp_WhoIsActive
If you need it, or just like to see more information, you can also configure the procedure with a lot of parameters. If you want to see all the options you can configure, just set the documentation parameter to 1 (true):
EXEC master.dbo.sp_WhoIsActive
  @help = 1
The options
If you start using sp_WhoIsActive more and more, you’ll get your own set of favorite options. It all depends on the purpose you’re using the procedure for. Most of the time, I use it to determine why queries run slow, or why the performance of the SQL server is so low.
The information sp_WhoIsActive retrieves gives you a good indication of what SQL Server is doing, or what queries are bugging each other. I’ll list my favourite options below:
First, I set @show_own_spid on, so I can see my own query in the resultset.
The second option I love is @get_plans. This shows you the execution plans of the running queries:

Another great parameter to set is @get_outer_command. That way, you won’t just see the query running at the moment, but also the outer-command of the query (in the example below, the INSERT INTO the temp table is executed from within the stored procedure you see in the right column):

To see which transaction logs are used when running your query, set @get_transaction_info to 1:
![]()
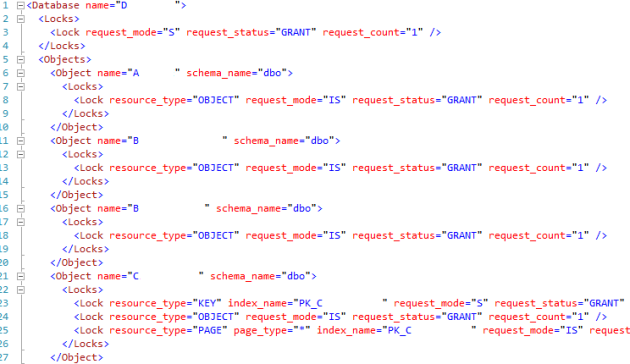
Information regarding locks can be found, by setting @get_locks to 1:

If you click the XML, you’ll see which locks are granted, pending or denied:
The last option I’d like to set, is @get_additional_info. This will show you more information regarding the connection settings, session variables, etc:

Clicking the XML shows you the properties I mentioned above:

So this is what the query looks like, the way I personally like to use it:
EXEC master.dbo.sp_WhoIsActive
  @show_own_spid = 1,
  @get_plans = 1,
  @get_outer_command = 1,
  @get_transaction_info = 1,
  @get_locks = 1,
  @get_additional_info = 1
Conclusion
Wait types are your keys to open the door of the next level of SQL Server. Not all wait types are that easy to read and understand, but there are plenty of resources to be found online. For example, just take a look at the rest of the posts today. Most of the posts for T-SQL Tuesday can be found on Twitter, when you search for #TSQL2sDay.
I want to say thanks to the employees at Coeo for the easy explanation of some of the wait types!


Good info. Thanks for taking part in T-SQL Tuesday #49.
Pingback: T-SQL Tuesday #49: Wait For It Roundup | SQLSoldier